Finance: Using fundamental and technical analysis to gauge stocks
PHUKET: When I decide that a stock could either be worth buying or worth placing on a watch list, the first thing I do is look at the stock’s fundamentals using a stock research and marketing tool called ‘MarketSmith’.
Using small cap LGI Homes (NASDAQ: LGIH) as a sample stock, let’s look at some fundamental data that will help decide whether its worth owning or watching.
Return on Equity (ROE) is a key measure of profitability that calculates how many dollars of profit a company generates with each dollar of shareholders’ equity. An ROE of more than 10-15 per cent is good, while LGIH’s ROE of 25 per cent is very healthy.
Quarterly revenue or sales along with earnings per share (EPS) should both be going up year-on-year and that’s the case with LGIH. Quarterly or sequential increases may also be a consideration, but keep in mind that some sectors like housing and retail are very cyclical.


Market capitalization, float and shares outstanding will tell you how big and well traded a stock is. LGIH has a market capitalization of about US$672 million, making it a small cap. A few hundred thousand shares are traded per day, meaning that it’s reasonably well traded for a company of its size. A more lightly traded stock will be more volatile.
What the underlying company does is also important. LGIH is focused on the design, construction and sale of single family homes in strong growth markets within the US.
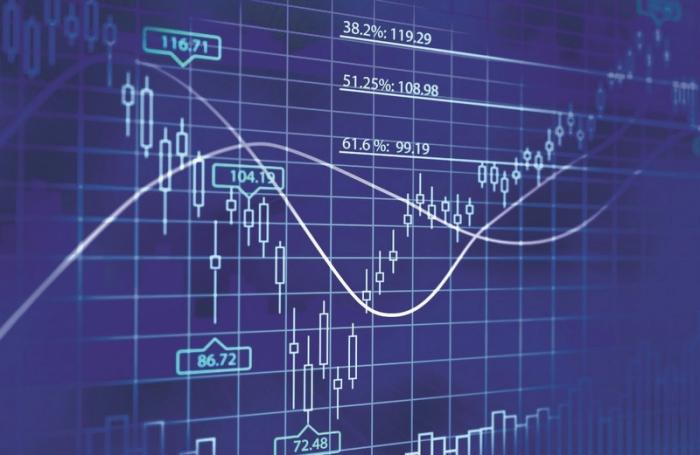
While the above fundamentals are important, a technical chart is the most important consideration for when to buy and when to sell. For this, I use a program called ‘TeleChart 2000’, which allows me to look at the main time frames for a stock.
I will start my technical analysis with a monthly chart where I want to visually see a long term uptrend. Looking at LGIH’s chart shows that it’s not an old stock as it only went public in 2013, then moved sideways until 2015, when it quickly lurched significantly higher before coming back down again.
Overall, LGIH’s technical chart is showing an uptrend. I also prefer to buy stocks after pullbacks and LGIH’s chart is clearly showing a pullback for roughly the last four months of 2016.
I will then take a closer look at the weekly chart. Usually stocks in bull markets will make strong moves upward and this will be picked up by a weekly chart. A strong upward move will also build up selling pressure as some investors or traders decide they want to take profits off the table. This causes shares to eventually peak and fall off until the ‘smart money’ comes back in for more shares on the dip and causes the uptrend to continue past the old previous high.
A daily chart and a 30-minute trend should also be reviewed. Keep in mind that detailed charts have more day to day noise, but, they can be useful for spotting resistance levels.
Remember: winning stocks will go through corrections and this is perfectly normal. LGIH has all the hallmarks of potentially being a winner moving forward. That’s why I am keeping a close eye on it.
Don Freeman, BSME, is president of Freeman Capital Management, a Registered Investment Adviser with the US Securities Exchange Commission (SEC), based in Phuket. For more information, contact 089-970 5795 or email freemancapital@gmail.com.
— Don Freeman

![]()
Join the conversation and have your say on Thailand news published on The Thaiger.
Thaiger Talk is our new Thaiger Community where you can join the discussion on everything happening in Thailand right now.
Please note that articles are not posted to the forum instantly and can take up to 20 min before being visible. Click for more information and the Thaiger Talk Guidelines.